
The eternal struggle with simple server monitoring#
As DevOps and Cloud Engineers, we spend our days orchestrating Kubernetes clusters, writing Terraform files, and building complex CI/CD pipelines. But away from these large enterprise projects, we all have that one Hetzner VPS, a few cheap VMs at Netcup or IONOS, and various small instances for client work.
And that’s where the frustration started. How do you keep an eye on these servers without turning it into a week-long system engineering project?
If you want to monitor Linux servers today, you usually end up in one of three dead ends:
- The Self-Hosting Trap: You set up the classic stack (Prometheus, Node Exporter, Grafana, Alertmanager). It works great, but it comes with a massive maintenance overhead. You have to patch the monitoring server, manage backups, and eventually face the ironic question: Who monitors the monitoring server if it goes offline?
- The Credit Card Minefield: You use enterprise tools like Datadog or New Relic. They are fantastic, but completely oversized and way too expensive for a few simple VMs. On top of that, their pricing models often feel like a guessing game. And GDPR compliance? Their US-based servers are a regulatory headache for European clients.
- The Uptime Fallacy: You rely on basic external ping checkers. Sure, you know if port 443 is responding. But you only find out that the disk is 100% full or that your PostgreSQL database crashed in a silent boot loop after the app has been dead for hours and clients start sending angry emails.
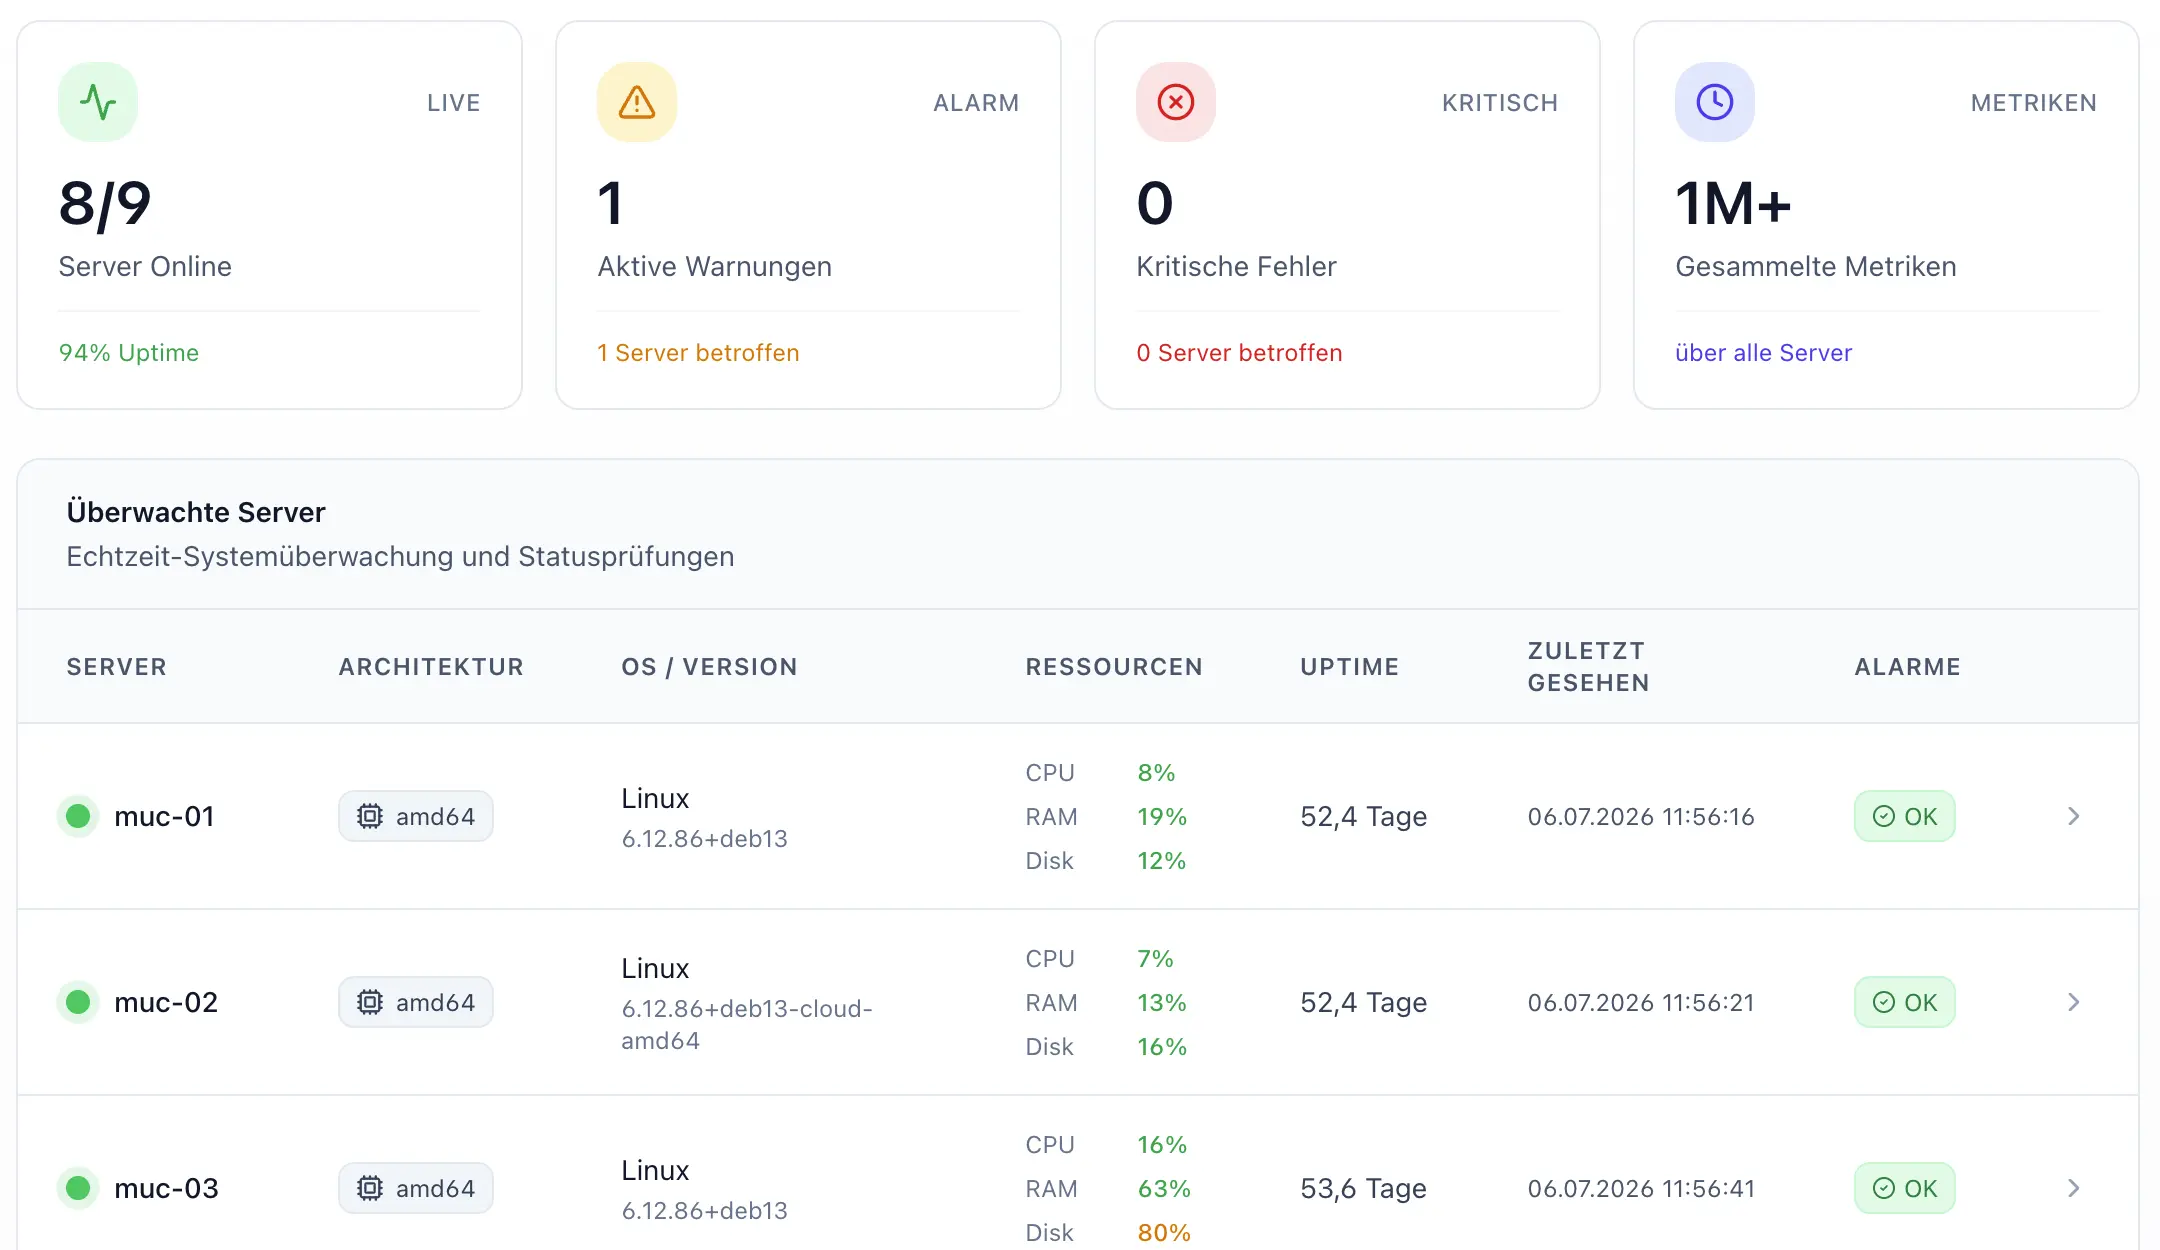
We wanted simple, genuine white-box monitoring that knows the internal health of the server (CPU, RAM, disk space, systemd services, and Docker containers), is ready to go in two minutes, requires no firewall configurations, and keeps data safe within the EU.
Since we couldn’t find anything matching that description, we decided to build it ourselves: WatchGrid .
The Vision: No config, no open ports, no bloat#
Our goal was to build a tool that feels as simple as an uptime checker, but provides the depth of a full server monitoring agent.
Four core principles guided our development:
- One-Command Installation: No long configuration files or manual setups. Run a single command in the terminal (
curl | sh), and the server instantly shows up in the dashboard. - Security via Outbound-only TLS: No one wants to open inbound ports for monitoring. Our agent (written in Go) establishes a secure outbound HTTPS connection to the WatchGrid API. No firewall tweaking required.
- Zero Maintenance: The agent uses almost no CPU, only a few megabytes of RAM, and updates itself in the background automatically.
- Hosted in Germany: The entire stack runs on servers in German, ISO 27001-certified datacenters. No cookies, no tracking, 100% GDPR compliant.
How the Data Flows#
The architecture is simple and lightweight. The agent gathers system metrics locally and pushes them securely to our API:
graph TD
    subgraph "Your Linux Server"
        Metrics["System Metrics (CPU, RAM, Disk, systemd, Docker)"]
        Agent["Go Agent (Lightweight)"]
        Metrics --> Agent
    end

    subgraph "WatchGrid Backend (Germany)"
        API["WatchGrid API Gateway"]
        DB["Secure Database"]
        Dashboard["Dashboard (Uptime & Resource usage)"]
        Alerting["Alerting System"]

        API --> DB
        DB --> Dashboard
        DB --> Alerting
    end

    subgraph "Notifications"
        Channels["Channels (Slack, Discord, Email, SMS, ntfy)"]
    end

    Agent -->|HTTPS Outbound / TLS| API
    Alerting --> Channels

    style Agent fill:#1e40af,stroke:#1e3a8a,color:#fff
    style Dashboard fill:#10b981,stroke:#047857,color:#fff
    style Alerting fill:#ef4444,stroke:#b91c1c,color:#fff
From Internal Tool to SaaS Product#
What started as a small script to monitor our own VMs quickly grew. When we showed it to other developers and agency partners, the response was always: “That is exactly what we need for our servers.”
Agencies managing a fleet of client servers faced the exact same issues. They wanted to provide clients with clean uptime and resource reports without paying a fortune or building and hosting complex custom Grafana set-ups.
So we spent the last few months polishing the dashboard, scaling the backend, and integrating all the notification channels you actually want—including Email, Slack, Discord, Gotify, Ntfy, and even SMS alerts for critical downtime.
A Fair Pricing Model for Developers#
As developers, we hate opaque pricing. We wanted to make sure WatchGrid is permanently free for small personal projects and side gigs.
Our Free Tier is here to stay:
- Monitor up to 3 servers (agents)
- 5-minute polling interval
- 24-hour history
- Notifications via Discord, Gotify, Ntfy, and Webhooks
For growing workloads or business needs requiring shorter intervals (down to 30 seconds), longer histories, and business alerting (like SMS or Slack), we offer plans (Basic, Pro, and Enterprise) starting at €12 per month, with no lock-ins.
Give it a spin!#
We built WatchGrid to make server monitoring simple and stress-free again. No configuration headaches, no maintenance, just a reliable alerting system that lets you sleep at night.
Setting up your first server takes less than a minute. Drop by watchgrid.de and try it out. We would love to hear your thoughts, feedback, and ideas!